
Many people have had the experience of going to the optometrist thinking that they don’t need new eyewear because they can see things just fine. Then they try a new prescription and – BOOM – they see details that they never realized they were missing.
Just as the correct eyewear can change what you see and how you see it, marketing professionals can experience that same BOOM moment when marketing data is visualized with dashboards in a way that allows them to make better decisions more quickly.
A marketing data dashboard is a tool used to visualize KPIs (key performance indicators) about the impact of marketing efforts in a way that is immediately understood.
But what are the strategies, tactics, and trends for visualizing marketing data with dashboards?
To help answer this question, Ascend2 fielded the Visualizing Marketing Data with Dashboards Survey.
Here are a few noteworthy findings from the Asend2 research study and some tips on how you can apply the findings to have 20/20 vision of your marketing data.
1. Determine Your Primary Objectives
It is critical to keep your primary objectives in mind when building your dashboard.
Improving marketing decision-making is a primary objective for a 55% majority of marketing professionals, and nearly half (49%) say improving the efficiency of marketing is a primary objective for a marketing data dashboard strategy to achieve.
Improving marketing decision-making is a primary objective for a 55% majority of marketing professionals. Click To Tweet

Also, the ability to attribute revenue to marketing efforts is necessary to determine marketing spend, areas that you need to optimize, and more.
When setting up your marketing dashboard, ask the following questions:
- Does this data help me make decisions?
- When setting a dashboard up for someone else (CEO, VP Sales, Social Media Team etc.): What questions do they need to be answered from the data?
- Do I need this data to make a decision? If no, it may not belong on your dashboard.
- Can I connect the data to revenue?
- If yes, show that connection.
- If no, how can I connect the data to revenue?
- What types of graphics fit the data best?
- Picking the correct graphic will improve the usefulness of the data.
- Do you include goals?
- Goals will help with your decision making.
- Goals will improve the usefulness of the data.
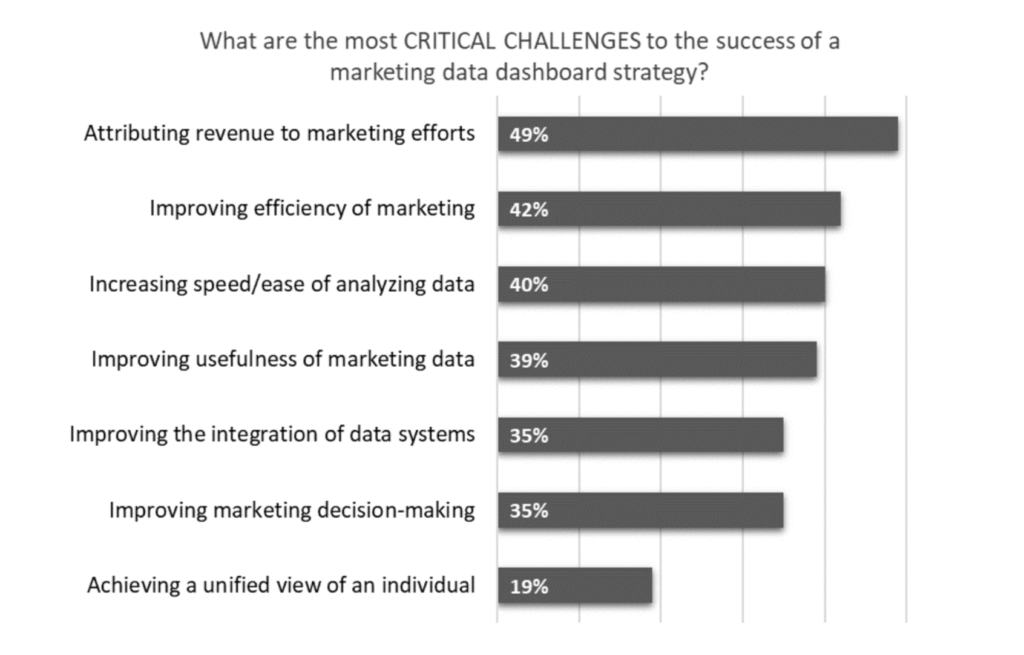
2. Don’t Let Critical Challenges Stop You
Attributing revenue to marketing efforts continues to be a critical challenge to the success of a marketing data dashboard strategy for 49% of marketing professionals.
Attributing revenue to marketing continues to be a critical challenge to the success of a marketing data dashboard strategy for 49% of marketers. Click To Tweet
If you want to succeed in marketing, you have to tackle your data issues. Data issues may not be as exciting to you as developing a promotional campaign or redesigning your website, but until you solve your fundamental data issues, you will not be able to improve your decision-making. Here are the two most common data challenges:
- The data you need does not exist.
- You have data silos and need to have data unification.
When you get the data and remove your data silos, you will be able to complete your data dashboard strategy.
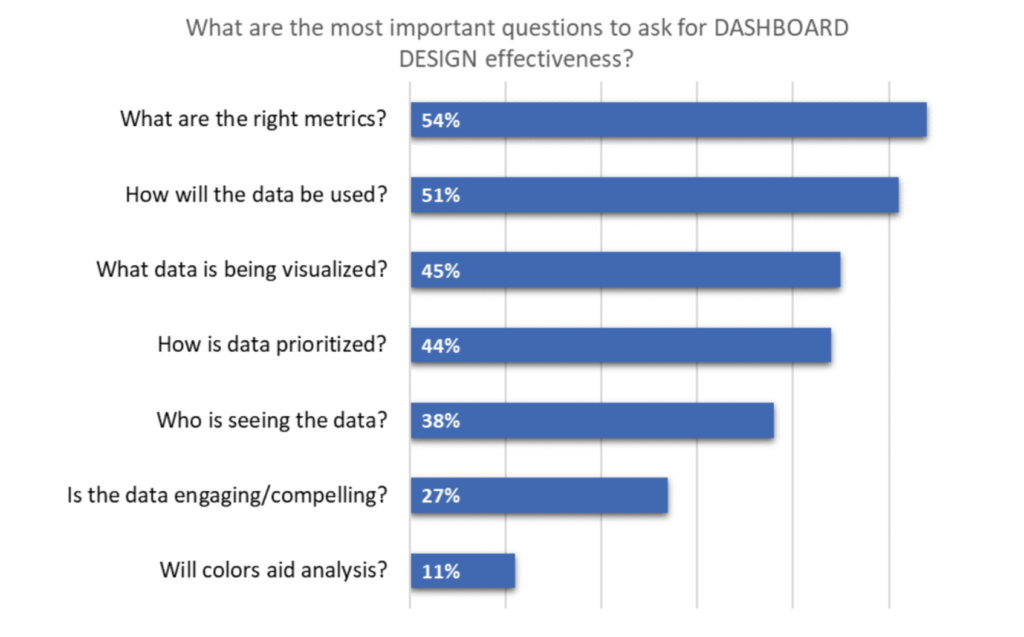
3. Design Your Dashboard
Asking and answering important questions during the dashboard design process will result in optimal effectiveness. A majority of marketers (54% and 51% respectively) say the designer must clearly understand what the right metrics are and how the data will be used.
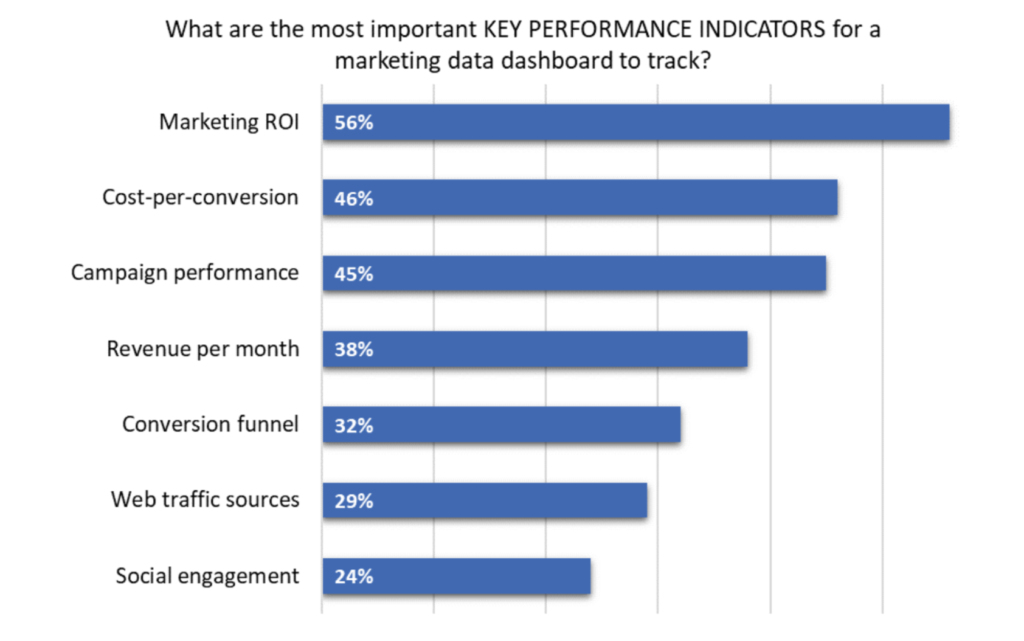
4. Agree on Key Performance Indicators
As previously shown, understanding what the right metrics (or KPIs) are is critical to effective dashboard design. Tracking the return on marketing investment (marketing ROI) is the most important KPI for a 56% majority of marketing professionals.
Tracking the return on marketing investment (ROI) is the most important KPI for a 56% majority of marketers. Click To Tweet
Here is additional information on dashboards:
- Capterra: Dashboard Software Review
- TapClicks: 6 Steps to Creating a Better Marketing Dashboard
- SuperMetrics: 4 Rules for Creating the Perfect Marketing Reporting Dashboard
- TechnologyAdvice: 10 Marketing Dashboards for Visualizing Performance
Get more research insights by downloading the entire Ascend2 study, Visualizing Marketing Data with Dashboards Survey Summary Report, and put it to work as you set-up your marketing dashboard tools.
- Home page
- Content Marketing
- Digital Marketing Strategy
- Digital Marketing Strategy
- Digital Marketing Strategy
- PPC
- SEO
- Social maketing
- WordPress web development